Split Cost Allocation Data for Amazon EKS

Let’s imagine we’re a town-based pizzeria, “Tony’s Tasty Pies.”
We’re not just slinging pizzas; we’re running a business, and to know if we’re doing well, we need to understand our unit economics. Simply put, how much profit are we making on each pizza we sell?
It’s tempting to just glance at our overall sales and expenses. “We sold 100 pizzas, the register says we made money, good enough!” But is it really? What if some pizzas are costing us way more than others? What if our delivery costs are eating into our profits? Without understanding the cost per pizza, we’re flying blind.
So let’s take a look at this breakdown for one of our classic cheese pizzas:

As you can see, the selling price is $20. But, the raw ingredients cost $4.50, labor is $3, utilities are $1.50, and our online ordering platform takes $4. That’s a total cost of $13. Subtract that from the $20 sale price, and we get a $7 profit per pizza. and this is our unit profit, our contribution margin.
Why does this matter?
Unit economics matter because they show how much profit a company makes per product or service sold. It’s not just about cutting costs but also about optimizing pricing, marketing, and product value to drive growth and ensure the business can really scale.
This same principle applies to any business, especially in the cloud. Just like Tony’s needs to know the cost of each pizza, businesses need to know the cost of running each application, each service, each user. And just like we need to break down the pizza costs, we need to break down our cloud costs to understand the true profitability of our services.
The EKS Cost Breakdown
At first glance we may think we only need to get cost and useage report for EKS so it’s seems straightforward , but in EKS services you will get only the control plane and not the EC2 instances that make up your worker nodes.


Great, so now select EC2-Instances in our billing dashboad service filter , we will takeout only the relevant instances that are part of our EKS cluster nodepools , but as Kubernetes clusters often run multiple services across shared infrastructure, and without mechanisms like pod-level cost visibility, it’s challenging to attribute costs accurately.
When you rely solely on node-level metrics, the cost distribution is blurred across applications, especially if you’re using Cluster Autoscalers (CAS) or tools like Karpenter, which dynamically adjust node resources based on workload demands. These autoscaling mechanisms make it even harder to correlate costs with applications because.
Why ?
- Node Pools Are Often Shared , that means multiple workloads, often from different teams or applications, share the same node pool. Without pod-level visibility, you only see total node costs without understanding how each application contributes.
- Dynamic Resource Scaling (like CAS, Karpenter) dynamically adjust resources, adding or removing nodes based on workload demands. This elasticity introduces variability, making cost tracking even more complex if you’re only looking at instance-level data.
Pod-Level Cost Allocation Solves This
With the introduction of CloudWatch Container Insights and split cost allocation for EKS, we can now correlate pod-level metrics (CPU and memory usage) directly with the cost of the underlying EC2 infrastructure. This enables:
- Retrive Application-Level Cost Attribution , now we can easily identify which pods and, by extension, which services drive costs.
- Make Informed Scaling Decisions by understanding which workloads are causing scale-up events and their associated costs.
- Perform Accurate Chargeback Models , so we can move from node-level approximations to application-level cost allocation.
First, install Amazon CloudWatch Observability
Amazon CloudWatch Observability Helm Chart simplifies the deployment of Amazon CloudWatch Agent Operator, allowing you to efficiently manage the CloudWatch Agent on your Kubernetes clusters.
By default, this Helm chart enables Container Insights enhanced observability, including:
- Container logging
- CloudWatch Application Signals
- Infrastructure metrics
- Application performance telemetry
This setup helps you collect and analyze key metrics and logs from your Amazon EKS cluster, providing deeper visibility into both infrastructure and application performance.
helm repo add aws-observability https://aws-observability.github.io/helm-charts
helm repo update aws-observability

helm install --wait --create-namespace \
  --namespace amazon-cloudwatch \
  amazon-cloudwatch aws-observability/amazon-cloudwatch-observability \
  --set clusterName=my-super-duper-cluster \
  --set region=us-east-1
Second, enable Split cost allocation data
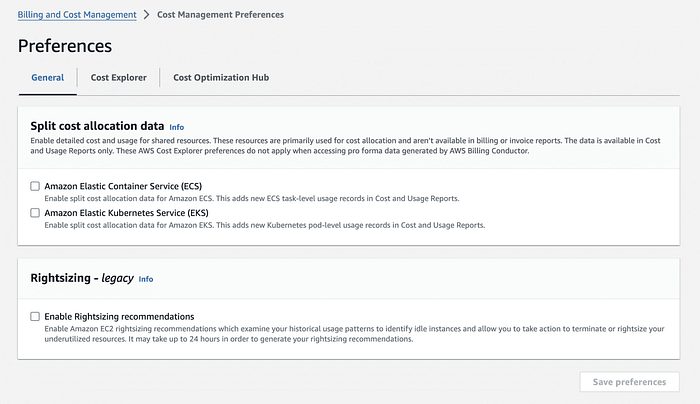
In our payer account , we need to opt-in “Split cost allocation data” from AWS Billing and Cost Management/AWS Cost Management preference page and select Amazon Elastic Kubernetes Service.
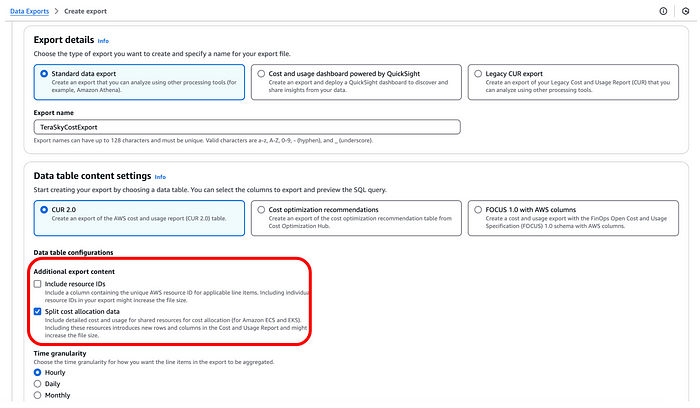
Then we will enable “Split cost allocation data” for a new or existing CUR report from the Cost and Usage Reporting preference page in the AWS Billing and Cost Management console. Alternatively you can enable ‘Split cost allocation data’ for a new or existing CUR 2.0 report in the Data Exports page in the AWS Billing and Cost Management console
Once enabled, the report will automatically scan for Kubernetes pods for the entire Consolidated Billing family (all clusters belonging to member accounts across all regions) and start preparing the granular cost data for the current month. In 24 hours, your CUR report will be ready with the new EKS cost and usage metrics.
Explanation of the CUR Report data

Multiple EC2 Instances
This report includes two different EC2 instances
The first one ,i-0abc123def456ghi1r5.xlarge (Memory-optimized) running Web application deployment (web-app-deployment-7c9d4f8b56).
The second one , i-0jkl789mno012pqr2c5.2xlarge (Compute-optimized) running Database and cache services (db-service-deployment, cache-service-deployment)
Let’s start with the total cost per deployment based on the report:
- Web App Deployment: $0.36
- Database Service Deployment: $0.23
- Cache Service Deployment: $0.11
This is really nice ,but we can can do even more …
Over-Provisioned Instance (r5.xlarge - Memory-Optimized)
The Web application pods (web-app-deployment-7c9d4f8b56) are
allocated on i-0abc123def456ghi1 (r5.xlarge).
Why we consider the instance as Over-Provisionned ?
- High unused memory (
splitLineItem/UnusedCostis nonzero). - Lower memory usage than expected (
splitLineItem/SplitUsagefor memory is not fully consuming available memory). - Savings Plan applied, but still has
NetUnusedCost, meaning AWS allocated more Savings Plan discount than needed.
What we can do ? we may consider will be to move the workload to a smaller instance (e.g., r5.large or m5.xlarge) to reduce waste.
Under-Provisioned Instance (c5.2xlarge - Compute-Optimized)
The Database and cache services (db-service-deployment, cache-service-deployment) run on i-0jkl789mno012pqr2 (c5.2xlarge).
Why we consider the instance as Under-Provisionned ?
- High CPU allocation (
splitLineItem/SplitUsagefor vCPU is high relative to instance capacity). - No significant unused cost (
UnusedCostis minimal), meaning the instance is being fully utilized. - If pod CPU requests exceed available instance CPU, there could be performance degradation.
What we can do ? we may consider scaling up to a c5.4xlarge or distributing workloads across multiple instances , or check if some compute workloads can be optimized or offloaded to managed services like managed AWS services like RDS or ElastiCache.
Keep in mind
The only data we getting for running containers is vCPU and Memory ,and the splits EC2 costs feature is using amortized pricing.
but other service such as:
- EKS Control Plane Costs ($0.10/hour per cluster in standard EKS)
- Data Transfer Costs (inter-AZ, inter-region, egress traffic)
These are show Unblended Costs, it creates an inconsistency when aggregating total costs.
Take alook at the following example:

Here we have a single EC2 instance that serves as the worker node for an EKS cluster. The instance runs two applications:
- AppZero
- AppProcessing
From this report, we can easily see how EC2 costs are split using vCPU and memory consumption for AppZero and AppProcessing.
First we may ask, which Cost Should Be Used for the Final App Costs: Amortized (Pod Split Cost) or Unblended (EC2 Instance)?
The correct answer depends on how you want to track your AWS costs — whether you need a real-time cost view (Unblended) or a normalized cost over time (Amortized).
if you org focus on amortized costs, this will shows how much of the RI/Savings Plan commitment has been allocated to a resource, and in this case we will take the pod level Split Cost.
Next , AWS charges $0.10 per hour per EKS cluster for the control plane. Unlike EC2 instances, this cost does not scale based on vCPU or memory usage. Instead, it is a flat fee for the cluster itself, regardless of how many workloads are running.
So how are we going to allocate EKS Control-Plane costs per application ?
The most logical approach is to allocate it based on the share of vCPU usage from the EC2 instances in the cluster.
From our CUR data, we know:
- Total vCPU = 2 (AppZero) + 6 (AppProcessing) = 8 vCPUs
- AppZero’s share = (2/8) * 0.1 = 0.025
- AppProcessing’s share = (6/8) * 0.1 =0.075
By applying this method, we ensure EKS Control Plane costs are distributed based on actual workload consumption.
However, data transfer and S3 costs and other resources introduce a whole new level of complexity because they don’t follow a simple resource-based distribution model.
Let’s take data transfer as an example , Unlike compute costs, data transfer is not directly tied to vCPU or memory usage. Instead, it depends on:
- Inter-AZ traffic → Data moving between Availability Zones.
- Inter-region traffic → Data traveling between AWS regions.
- Internet egress → Data leaving AWS to external destinations.
Since AWS CUR does not provide detailed per-application network traffic costs by default, we cannot rely on itfor accurate allocation.
Instead, we can do the following:
- Track actual network usage per application using AWS VPC Flow Logs or CloudWatch metrics.
- Proportionally allocate data transfer costs based on real traffic patterns rather than vCPU/memory usage.
This requires extra monitoring and logging because AWS does not automatically split data transfer costs by workload in CUR and in most cases it’s not really something you will spent develop on your own.
Conclusion
AWS Split Cost Allocation Data (SCAD) has significantly improved visibility into pod-level costs, eliminating the need for complex node-level drill-downs. This is especially valuable when using Cluster Autoscaler (CAS) or Karpenter, where nodes scale dynamically, making manual cost attribution difficult.
However, while SCAD simplifies EC2 cost breakdowns, there are still critical caveats when dealing with a full application cost view requires blending amortized and unblended costs, tracking network usage, and leveraging AWS tagging strategies for services like S3.
This mismatch means that simply summing up costs doesn’t give an accurate picture of what an application actually costs. The moment FinOps teams attempt to aggregate costs across multiple AWS services, they face conflicting numbers — each based on different pricing models.
Following up article — standardization is the Key ingredient
If an organization lacks a standardized way to allocate costs, different teams will draw different conclusions.
- Engineering might allocate costs based on pod vCPU usage
- Finance might rely on tagged resources and Unblended costs
- Product teams may only consider direct service costs (e.g., AI model inference costs, database usage)
Without a unified structure, these discrepancies lead to misaligned budgets, inaccurate customer-level cost calculations, and poor decision-making. Standardizing cost allocation ensures that every team is working with the same definitions, the same methodology, and the same numbers — eliminating confusion and improving financial transparency.
References
For further details on cost allocation, monitoring, and observability in AWS, refer to the following resources:
AWS Cost Allocation & Usage Reports
- AWS Cost and Usage Report — Split Line Item Table Dictionary — Understand how AWS splits cost allocation at the line-item level.
- Monitoring Amazon EKS Costs — Learn how to track and optimize Amazon EKS costs.
- AWS Cost and Usage Report — Split Cost Allocation Data — Detailed explanation of how AWS splits EC2 costs per Kubernetes pod.
- AWS Cost and Usage Report — Split Line Item Columns — Column breakdown for understanding cost allocation in AWS CUR.
- Enabling Split Cost Allocation Data in AWS — Step-by-step guide to enabling SCAD in AWS.
Amazon CloudWatch Observability
- Installing the CloudWatch Observability EKS Add-on — Instructions for deploying CloudWatch observability in Amazon EKS.
- CloudWatch Application Signals — Learn how to monitor application performance with CloudWatch Application Signals.
- Amazon CloudWatch Container Insights — Understand how to collect, aggregate, and analyze container metrics and logs.
- Installing and Configuring the CloudWatch Agent — Step-by-step guide for installing and configuring the CloudWatch Agent.
- Amazon CloudWatch Agent Operator on GitHub — Explore the source code and deployment details for the CloudWatch Agent Operator.
About the author
Elad Hirsch is a Tech Lead at TeraSky CTO Office, a global provider of multi-cloud, cloud-native, and innovative IT solutions. With experience in principal engineering positions at Agmatix, Jfrog, IDI, and Finjan Security, his primary areas of expertise revolve around software architecture and DevOps practices. He is a proactive advocate for fostering a DevOps culture, enabling organizations to improve their software architecture and streamline operations in cloud-native environments.